Many heralded mass vaccination programs as the end of the coronavirus disease 2019 (COVID-19) pandemic, with most developed governments managing to vaccinate a significant proportion of the population dismantling the restrictions designed to reduce the transmission of the severe acute respiratory syndrome coronavirus 2 (SARS‑CoV‑2).
However, with a large proportion of the developing world unvaccinated, new variants continue to emerge, and many of them show the ability to evade both vaccine-induced and natural immunity. The Beta, Delta, and Omicron variants have all shown at least some immune evasion ability.
Recently, researchers from the University of Copenhagen have been investigating the spread of two sublineages of the Omicron variant among Danish households.
Their research can be found on the medRxiv* preprint server while the paper undergoes peer review.
Study: Transmission of SARS-CoV-2 Omicron VOC subvariants BA.1 and BA.2: Evidence from Danish Households. Image Credit: NIAID
The researchers gathered data from the Danish register and linked all individuals to households by their personal identification number. They then excluded households with only one individual or more than six individuals living in one place and linked this with information on antigen and RT-PCR testing and vaccination records. Data from primary cases between December 2021 and January 2022 were also used, with a 7-day follow-up for secondary cases.
Primary cases were the first individuals within a household to test positive with the Omicron variant of concern BA.1 or BA.2, and secondary cases were positive cases within the same household shortly after.
The researchers produced ~25,000 SARS-CoV-2 genomes using the Illumina COVID test kit, with consensus sequencing called using custom IVAR implementation. Individuals were classified as unvaccinated if they had not completed a vaccination course, vaccinated, or booster-vaccinated.
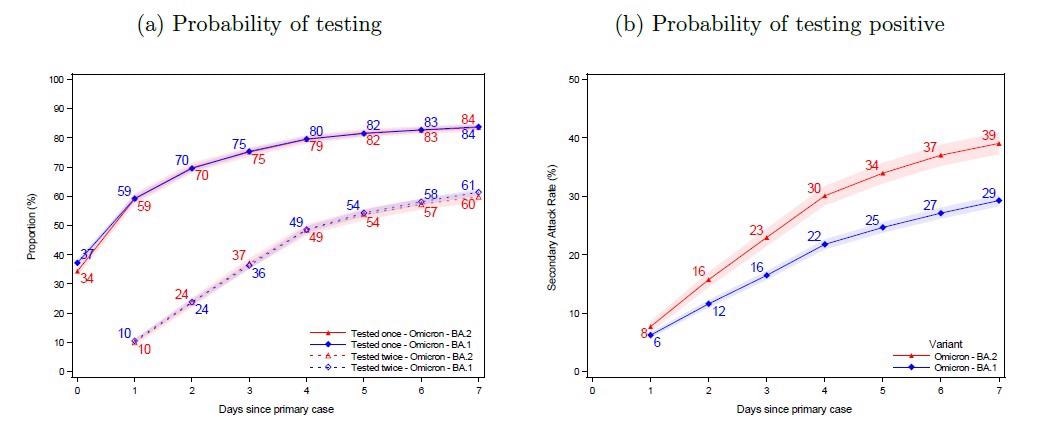
Panel (a) shows the probability of potential secondary cases being tested after a primary case has been identified within the household. Panel (b) shows the probability of potential secondary cases that test positive subsequently to a primary case being identified within the household. Note that the latter is not conditional on being tested, i.e. the denominator contains test-negative individuals and untested individuals. The x-axes show the days since the primary case tested positive, and the y-axes show the proportion of individuals either being tested (a) or testing positive (b) with either antigen or RT-PCR tests, stratified for the subvariant of the primary case. The SAR for each day according to the subvariant primary case can be read directly from panel (b). For example, the SAR on day 7 is 39% for BA.2 (red) and 29% for BA.1 (blue), whereas the SAR on day 4 is 30% and 22%, respectively. The shaded areas show the 95% confidence bands clustered on the household level.
The proportion of secondary cases within one household within a week of the first positive test was defined as the secondary attack rate (SAR). The adjusted odds ratio (OR) for infection was estimated in a multivariable logistic regression model, with the outcome variable as the test result for each potential secondary case.
The subvariant of Omicron contracted by the subject was used as an explanatory variable, and other confounding effects such as age, sex, and household size were considered in the final analysis.
In order to test if the subvariants behaved differently depending on the immune status of the primary cases, the scientists included the interactions between subvariant and vaccination status of cases.
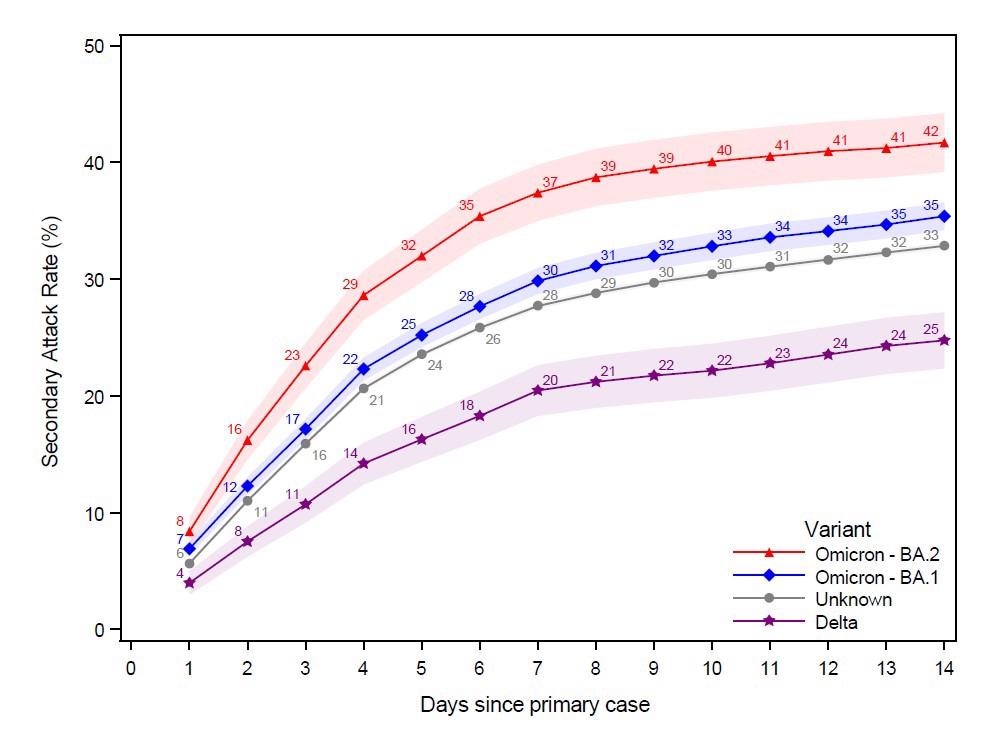
This figure shows the probability of potential secondary cases that test positive subsequently to a primary case being identified within the household in a 14-day follow-up period. Note that the latter is not conditional on being tested, i.e. the denominator contains test negative individuals and untested individuals. The x-axes show the days since the primary case tested positive, and the y-axes show the proportion of individuals testing positive with either antigen or RT-PCR tests, based on the subvariant of the primary case. The SAR for each day relative to the primary case can be read directly from the figure. For example, the SAR on day 14 is 42% for Omicron BA.2, 35% for BA.1, 33% for those without a known variant, and 25% for Delta. The shaded areas show the 95% confidence bands clustered on the household level. To allow for a 14-day follow-up, only primary cases with samples from 20 December 2021 to 5 January 2022 were included in this figure.
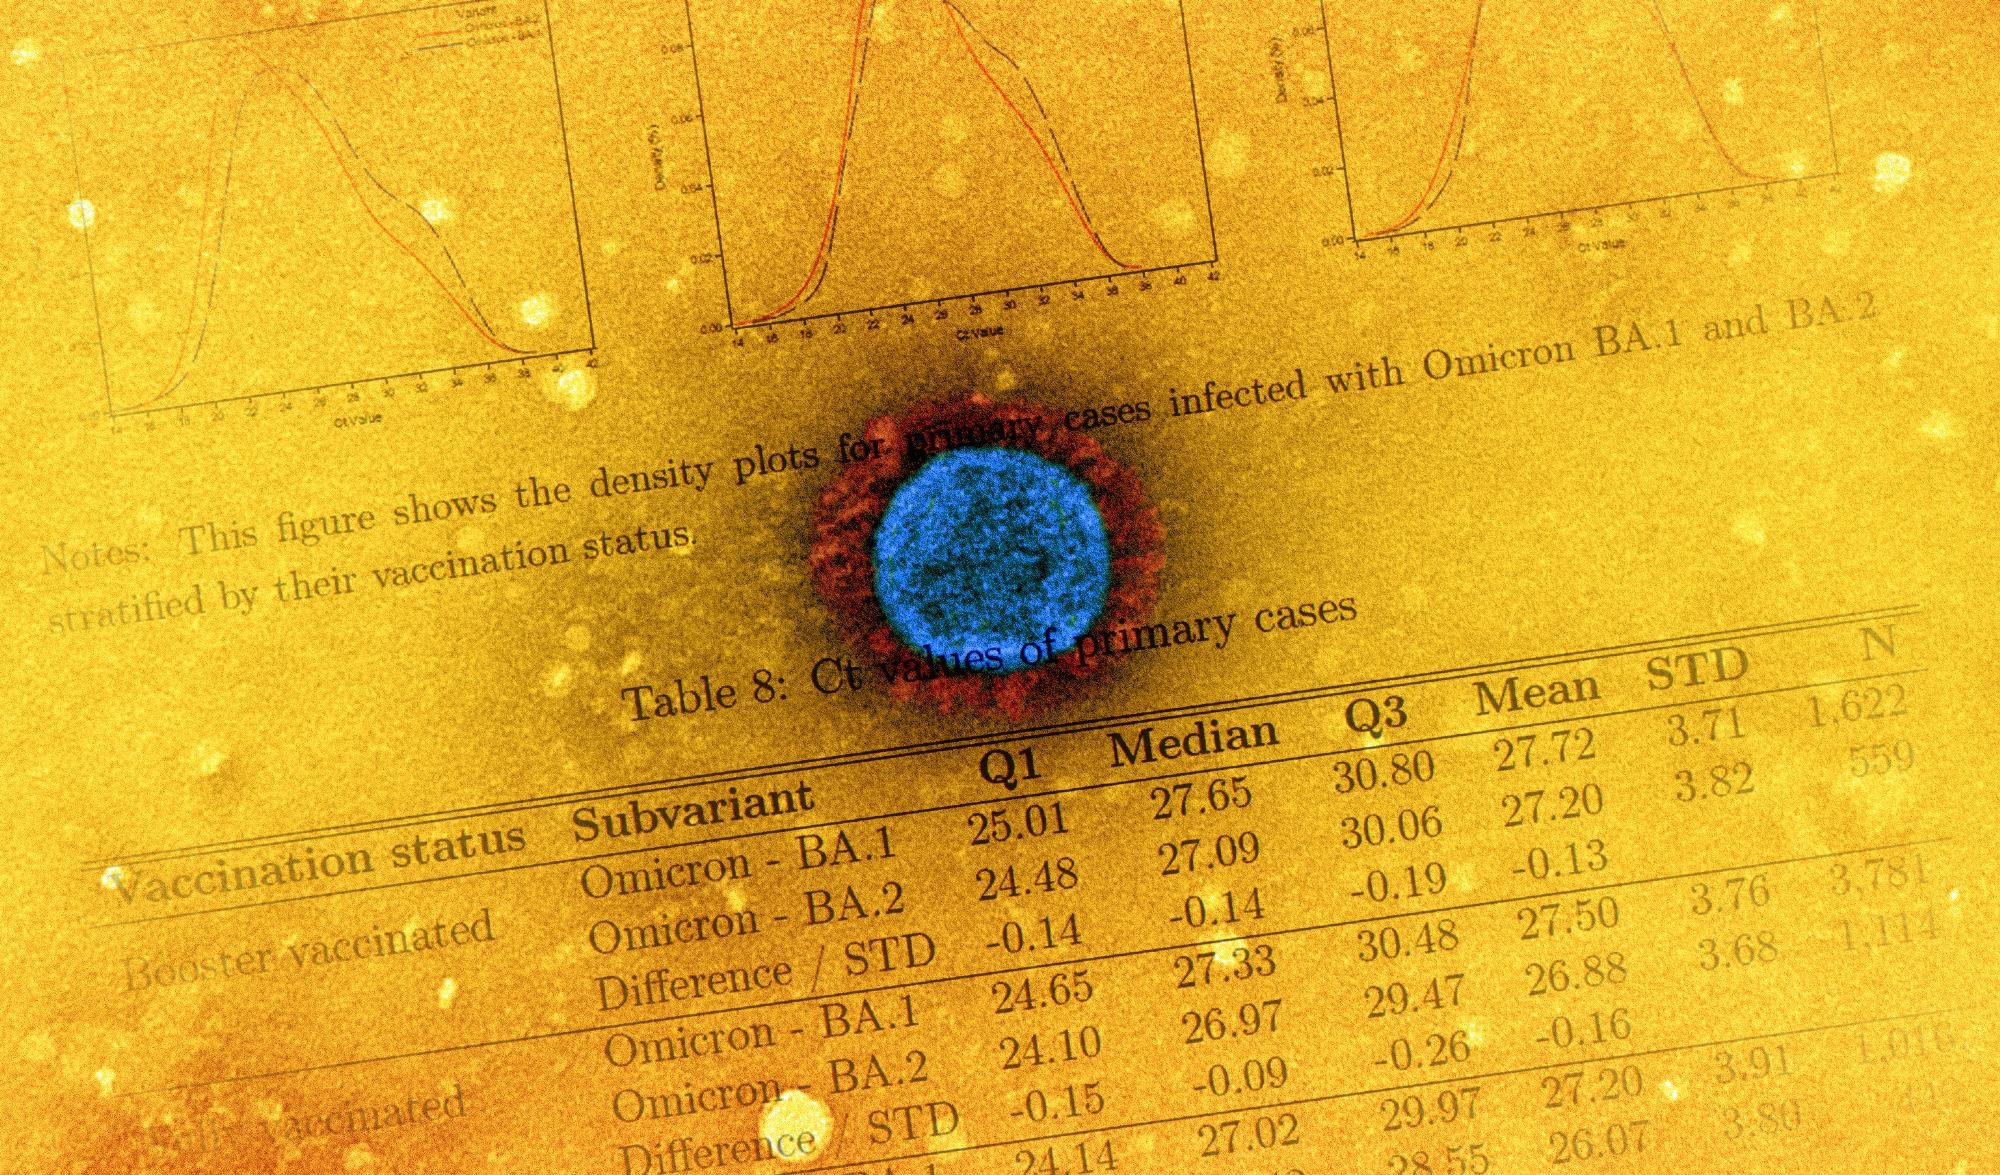
In total, the researchers examined 2,122 households with the BA.2 sublineage, with 1,792 secondary cases testing positive within seven days, out of 4587 – a SAR of 39%.
For BA.1, 6,419 households were identified, with 3,910 secondary cases out of a potential 13,358 – a SAR of 29%. The age, sex, household size and vaccination status were roughly the same between both groups.
84% of potential secondary cases were tested once within the first week, and 60% were tested twice. BA.2 showed a SAR of 8% on day one, compared to 6% for BA.1.
As expected, those who had received a booster vaccine had the lowest susceptibility to becoming a secondary case, followed by the double-vaccinated and then the unvaccinated. Vaccination did, however, appear to have less of an effect in protecting against BA.2 compared to BA.1.
When the primary case was booster-vaccinated, both sublineages showed lower transmissibility to secondary cases. Households in which the primary case was infected with BA.2 showed increased susceptibility for all individuals, no matter the vaccine status. Still, this effect was more exaggerated in vaccinated and booster-vaccinated individuals.
The authors highlight that their study shows that the BA.2 subvariants lead to a higher SAR than the BA.1 subvariant across all the studied groups. SAR was largely unaffected by age, sex, household sizes, and immunity groups.
Booster-vaccinated individuals, as expected, showed a reduced susceptibility and transmissibility for both subvariants. However, this study and multiple prior studies show worrying transmission levels to and from fully vaccinated individuals.
The researchers also point to the relative increase in susceptibility in vaccinated individuals compared to unvaccinated individuals for BA.2 compared to BA.1, which indicates extensive immune evasion properties – allowing the subvariant advantages in more highly vaccinated populations compared to other variants.
The information the researchers have gathered could be very useful for public health policymakers and epidemiologists and could help inform future policy – for both restriction measures and vaccine plans.
*Important notice
medRxiv publishes preliminary scientific reports that are not peer-reviewed and, therefore, should not be regarded as conclusive, guide clinical practice/health-related behavior, or treated as established information
- Transmission of SARS-CoV-2 Omicron VOC subvariants BA.1 and BA.2: Evidence from Danish Households, Frederik Plesner Lyngse, Carsten Thure Kirkeby, Matthew Denwood, Lasse Engbo Christiansen, Kåre Mølbak, Camilla Holten Møller, Robert Leo Skov, Tyra Grove Krause, Morten Rasmussen, Raphael Niklaus Sieber, Thor Bech Johannesen, Troels Lillebaek, Jannik Fonager, Anders Fomsgaard, Frederik Trier Møller, Marc Stegger, Maria Overvad, Katja Spiess, Laust Hvas Mortensen, medRxiv, 2022.01.28.22270044; doi: https://doi.org/10.1101/2022.01.28.22270044, https://www.medrxiv.org/content/10.1101/2022.01.28.22270044v1